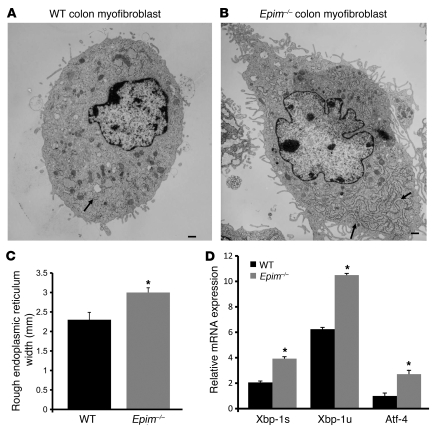
Figure 11. Electron microscopic analysis of Epim–/– and WT myofibroblasts.
(A) WT colon myofibroblast. (B) Epim–/– colon myofibroblast. Note the increase in RER stacks (arrows) in Epim–/– myofibroblasts compared with those in WT myofibroblasts. Scale bars: 1 μm. (C) Quantification of RER dilation. The shorts stacks of RER were more dilated in Epim–/– myofibroblasts than in WT myofibroblasts. (D) Increased expression of ER stress markers in Epim–/– myofibroblasts. Xbp-1s, Xbp-1u, and Atf-4 mRNA levels were quantified by qRT-PCR (n = 3 independent experiments). *P < 0.05.

