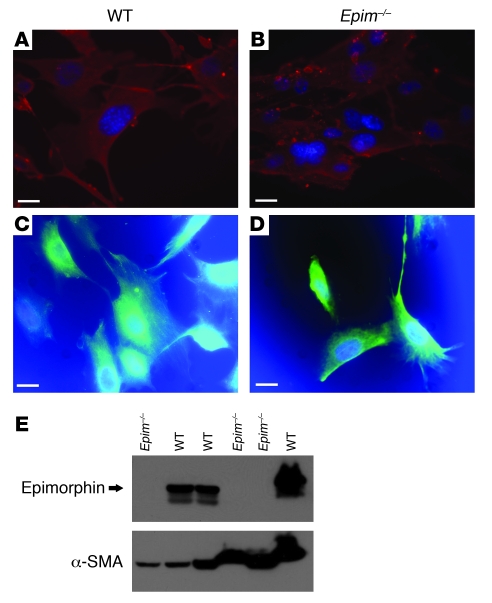
Figure 3. α-SMA, vimentin, and epimorphin expression in WT and Epim–/– colonic myofibroblasts.
(A–D) Representative immunofluorescence analyses of WT and Epim–/– colon myofibroblasts. Antibody to α-SMA and secondary antibody labeled with Cy3 (A and B), or antibody to vimentin and secondary antibody labeled with fluorescein (C and D), were used. Nuclei were labeled with DAPI (blue). α-SMA and vimentin expression was seen in WT and Epim–/– myofibroblasts. Scale bars: 20 μm. (E) Representative immunoblot to quantify epimorphin expression in colonic myofibroblasts obtained from 6 primary cultures from WT (n = 3) and Epim–/– (n = 3) mice. The 34-kDa band corresponds to epimorphin protein. Lower–molecular weight shadow bands represent alternatively spliced syntaxin 2′ and 2′′ (25). Blots were probed with α-SMA antibody to control for differences in loading.

