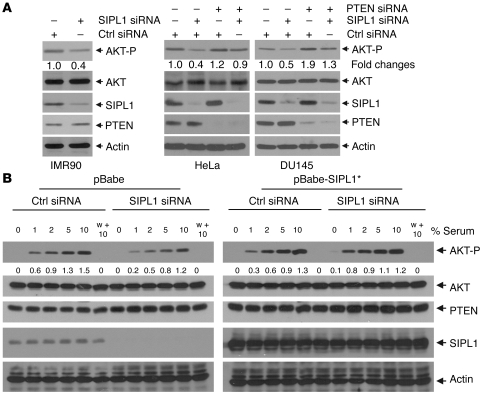
Figure 2. SIPL1 facilitates AKT activation by reducing PTEN function.
(A) IMR90, HeLa, and DU145 cells were infected with the indicated retrovirus, followed by Western blot analysis for the phosphorylation of AKT Ser473 (AKT-P), AKT, SIPL1, PTEN, and actin using specific antibodies. The relative levels of AKT-P were normalized against the respective AKT and then expressed as fold change in AKT-P relative to that in Ctrl siRNA–treated cells. (B) DU145 cells were first infected with Ctrl siRNA or SIPL1 siRNA, followed by infection with pBabe or pBabe-SIPL1* (siRNA-resistant SIPL1). Infections were selected in media containing proper antibiotics to achieve 100% infection. Cells were then serum starved for 6 hours, stimulated with the indicated doses of serum for 90 minutes (according to the predetermined kinetics to achieve the plateau level of AKT activation; Supplemental Figure 5A), and analyzed for the indicated proteins by Western blot. Individual blots in the left and right panels, respectively, were derived from the same membranes. w + 10, wortmannin (100 nM) plus 10% serum. AKT-P was quantified by first normalizing AKT against the respective actin and then normalizing AKT-P against the normalized total AKT. Levels of AKT-P are presented below the AKT-P panel. Quantification of AKT-P was performed using Scion Image software on scanned Western blot images. Experiments in A and B were repeated 3 times, and representative images are shown.

