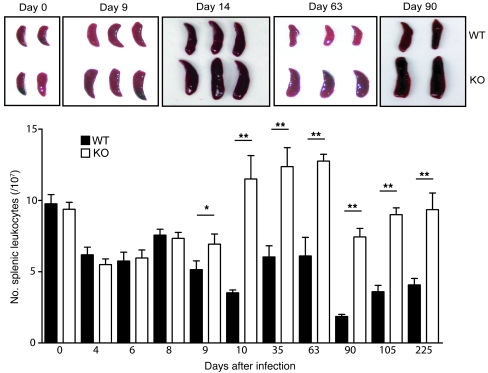
Figure 4. Splenomegaly during persistent LCMV clone 13 infection of 2B4-KO mice.
At various time points after LCMV clone 13 infection, spleens were photographed and the total number of splenic leukocytes determined after red blood cell lysis. Mean splenocyte counts (±SEM) are plotted for WT and KO mice (n = 4–10/group) throughout the course of infection. *P < 0.05, **P < 0.01 (2-tailed unpaired Student’s t test).

