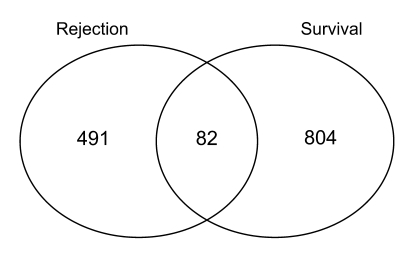
Figure 1. Overlap of genes associated with graft loss and those associated with rejection.
We identified the genes associated with graft loss in a Cox regression model (P < 0.0001) and compared them with those genes whose association with rejection versus nonrejection was significant (t test) at P < 0.0001. The number of genes that were unique to each list as well as the number of overlapping genes are shown.

