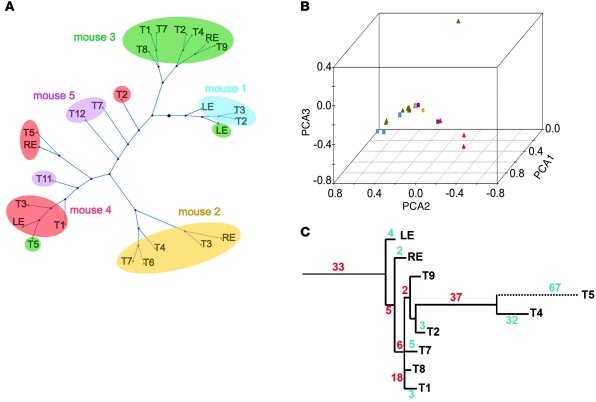
Figure 3. Tumors cluster according to mice.
Tumors (n = 26) taken from 5 mice were clustered according to their pattern of mutations detected by GW-SNP profiling (see Supplemental Figure 4). Distance matrix (A) or PCA (B) showed that tumors from the same mouse tended to cluster together. Colored symbols in B correspond with mice color-coded as in A. (C) Phylogram of the 9 tumors from mouse 3. The number of mutations conserved along each horizontal branch is indicated in red. The number of mutations unique to each tumor is shown in blue. The tissue origin of other tumors is given in Supplemental Table 2.

