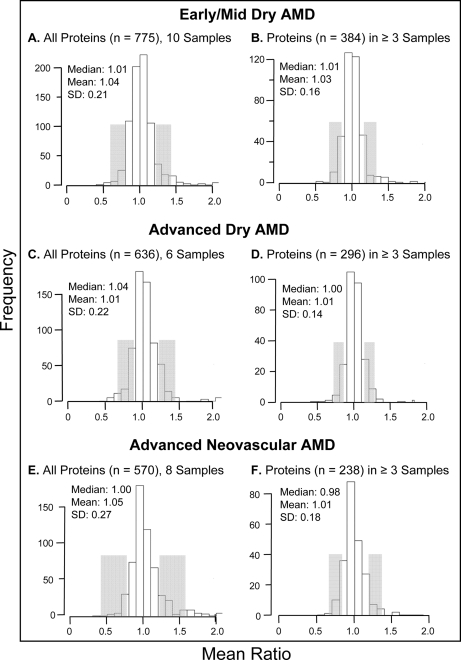
Fig. 4.
Distribution of protein ratios by disease category. The distributions of protein ratios (AMD/control) are shown for proteins quantified in early/mid-stage AMD, advanced dry AMD, and advanced neovascular AMD tissues, including for all proteins quantified and proteins quantified in ≥3 tissues per disease category. Median, mean, and S.D. values are indicated with the number of tissues analyzed per category; protein ratios 1 S.D. from the median are shaded.

