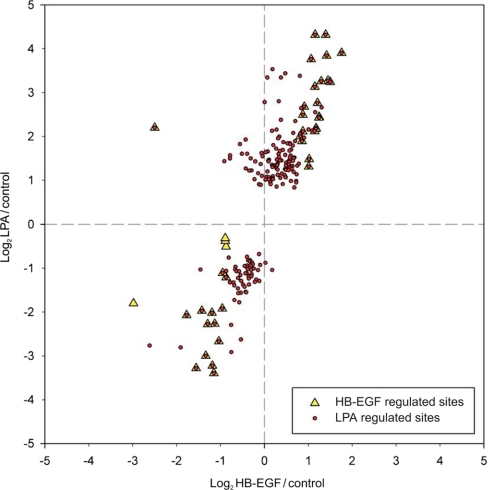
Fig. 4.
Differential phosphorylation changes upon treatment with LPA and HB-EGF. A scatter plot analysis of phosphorylation sites significantly and reproducibly changed upon LPA (●) or HB-EGF (▴) treatment in both experiments is shown. Values on the x axis (y axis) correspond to log2-transformed average phosphorylation ratios determined upon HB-EGF (LPA) stimulation of A498 cells.

