Fig. 2.
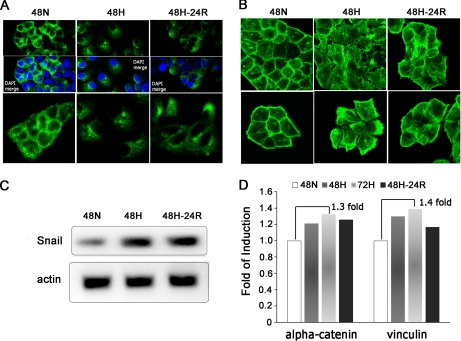
Hx-induced morphological changes, delocalization of E-cad, and possible dissociation of E-cad-α-catenin complexes. A, immunostaining of E-cad to visualize its localization and expression levels under the indicated conditions. Cells were counterstained with 4′,6-diamidino-2-phenylindole (DAPI) (blue). E-cadherin appears to be localized to the cell periphery under Nx (left panel), but this distribution was disrupted under Hx (middle panel) and Reox (right panel) accompanied with a concomitant drop in signal intensity. Magnification, ×63. B, visualization of F-actin via FITC-phalloidin staining. Hx and Reox appear to induce stress fiber and ruffle formation as well as an observable increase in cell size. Magnification, ×63. C, analysis of human Snail transcript levels through RT-PCR. Snail was found to be similarly up-regulated under Hx and Reox. Actin levels served as control. D, secreted levels of α-catenin and vinculin quantitated by iTRAQ analysis were found to be elevated under Hx and Reox. 48N, 48-h normoxia; 48H, 48-h hypoxia; 72H, 72-h hypoxia; 48H-24R, 48-h hypoxia followed by 24-h normoxia.

