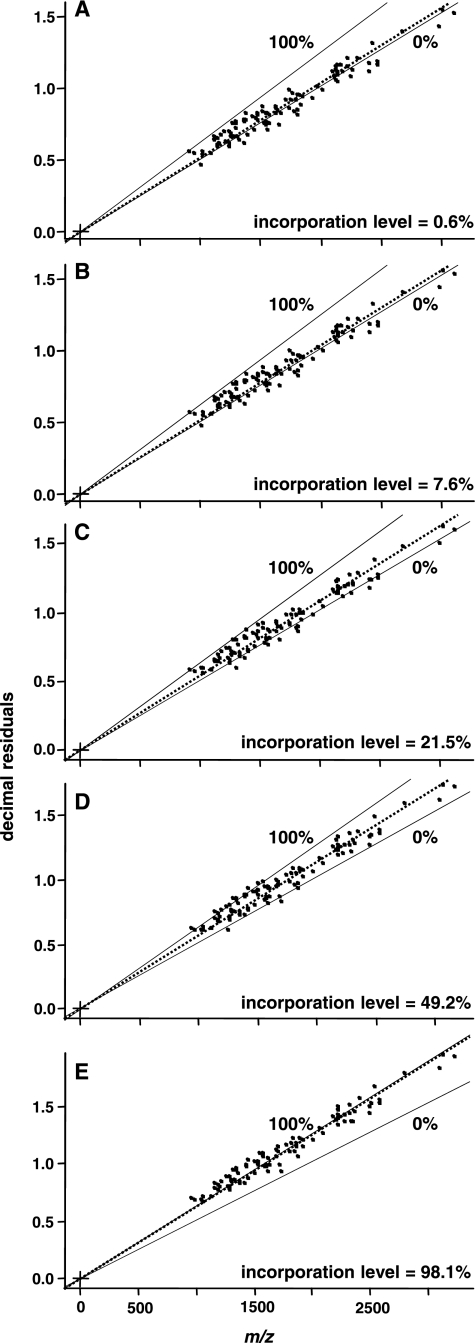
Fig. 3.
Practical data set of P. putida ML2 peptides measured by nano-LC LTQ Orbitrap-MS. In each case, exactly 100 peptide masses (highest intensity peak) from 22 different proteins were plotted according to their exact mass and decimal place. The slope of the regression line passing through the data points was calculated by means of an R-script, resulting in the given figures (A–E) for the different substrate ratios (0, 10, 25, 50, and 100 atom %). For example, the experimental incorporation level of 7.6 atom % (B) was calculated based upon the 12C (0.000512) and 13C slope (0.000632) for the 10 atom % labeling experiment.

