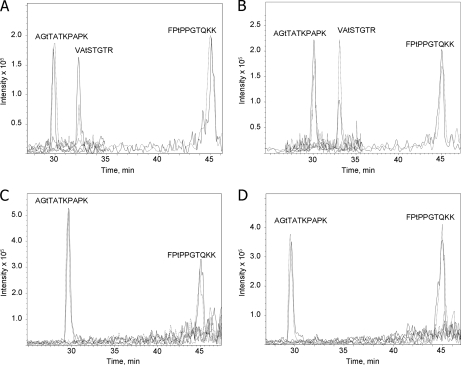
Fig. 4.
Quantitative mass spectrometric analysis of phosphorylated peptides of CP29. A, ion chromatograms of the phosphorylated peptides from wild type labeled with light isotope (dashed line) in state 1 and with heavy isotope (continuous line) in state 2 analyzed by LC-MS. The sequences of three N-terminal phosphorylated peptides from CP29 are shown above the corresponding ion intensity peaks. B, same as A except that the wild-type phosphorylated peptides were labeled with heavy isotope in state 1 (continuous line) and with light isotope in state 2 (dashed line). C, ion chromatograms of the phosphorylated peptides from the stt7 mutant labeled with light isotope (dashed line) in state 1 and with heavy isotope (continuous line) in state 2. D, same as C except that the phosphorylated peptides from stt7 were labeled with heavy isotope in state 1 (continuous line) and with light isotope in state 2 (dashed line). Lowercase t in the sequences designates phosphorylated threonine residues.

