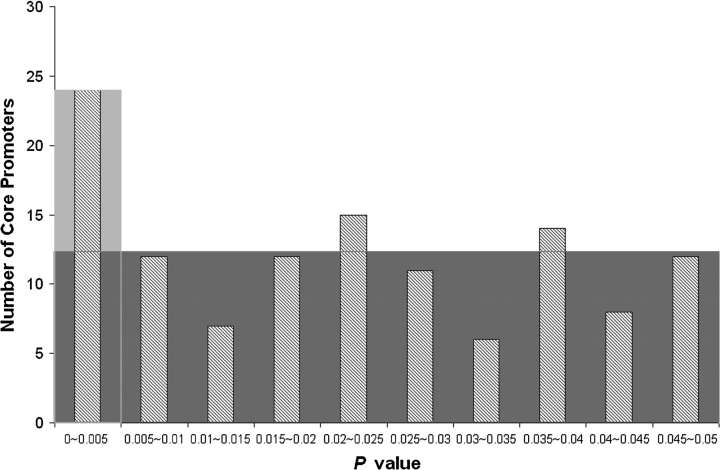
FIG. 2.—
The observed distribution of core promoters that have evolved significantly faster than neutral controls. Striped bars represent the observed numbers at different P value intervals, and the gray square represents the uniform distribution expected from chance alone. The light gray square highlights the positively selected promoters identified in this study (P < 0.005, false discovery rate = 50%).

