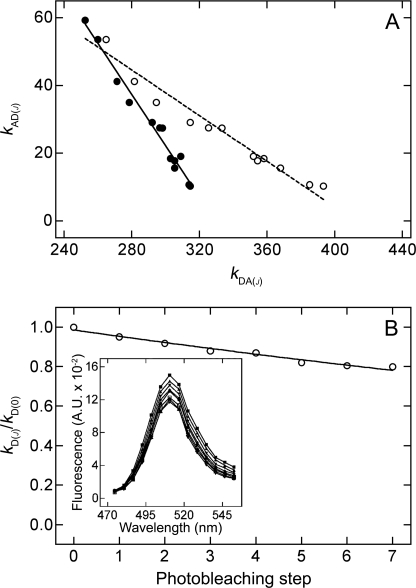
FIGURE 1.
Emission from eGFP-M2 upon photobleaching at 514 nm. A, cell coexpressing eGFP-M2 and eYFP-M2 was subjected to 12 rounds of photobleaching and spectral analysis to obtain values of kDA(j) and kAD(j) for the cell before bleaching (j = 0) and after each successive round (j = 1–12) (●). The stepwise decrease in kAD(j) was accompanied by an increase in kDA(j) that arose from donor-dequenching. Each value of kDA(j) also was adjusted according to Equation 4 to correct for photobleaching of the donor (○). The lines were fitted to the uncorrected (●) and corrected data (○) by linear regression, and the corresponding x-intercepts represent kDe and kDec, respectively, as described in the text. B, cell expressing eGFP-M2 alone was subjected to successive rounds of photobleaching. The emission spectrum was acquired after each step (j), and the intensity at the maximum (kD(j)) is shown relative to that from the unbleached cell (kD(0)). The line represents the best fit of Equation 3 to the data, and the fitted value of fr is 0.989 ± 0.001. Inset, the emission spectrum was recorded before photobleaching (■) and after each successive step j (▴, ▾, ♦, ●, □, ▵, ▿). A.U., arbitrary units.

