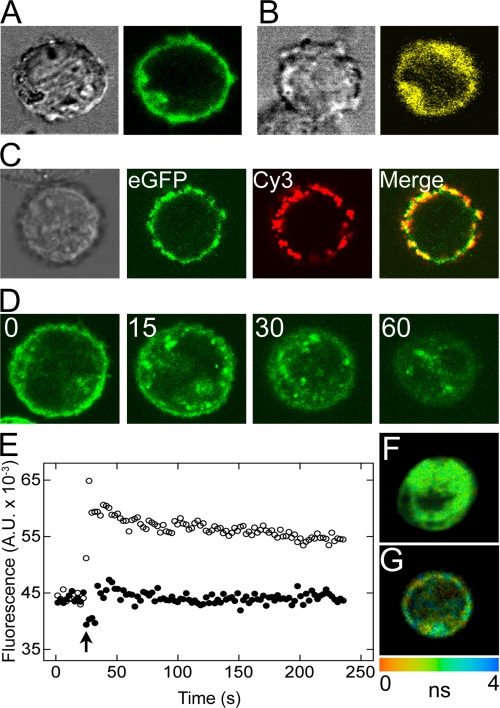
FIGURE 2.
Localization and activation of eGFP-M2 and eCFP-M2 in live CHO cells. A and B, left panel shows the contrast image of a CHO cell expressing eGFP-M2 (A) or eYFP-trFz1 (B), and the right panel shows the confocal image of the same cell irradiated at 458 nm. Similar results were obtained with eYFP-M2 and eCFP-M2. C, CHO cells expressing eGFP-M2 were labeled with a mouse anti-GFP primary antibody and an anti-IgG (mouse) secondary antibody conjugated to Cy3. The individual panels are as follows: from left to right, contrast image, fluorescence from eGFP upon irradiation at 488 nm, fluorescence from Cy3 upon irradiation at 543 nm, and the merged image from 2nd (eGFP) and 3rd (Cy3) panels. D, CHO cells expressing eGFP-M2 were imaged at different times after the addition of 0.1 mm carbachol. Punctate densities appeared at the membrane after 15 min, followed by internalization after 30 min; by 60 min, the loss of signal from the plasma membrane was almost complete. The same cell is shown at each time. E, cells coexpressing eCFP-M2 and Gαqi9 were monitored at 525 nm for Ca2+-induced fluorescence. At the time shown by the arrow, the cells were treated with 10 mm oxotremorine-M alone (○) or together with 1 μm N-methylscopolamine (●). F and G, decay of fluorescence was monitored from cotransfected CHO cells in which eGFP-M2 and eYFP-M2 were localized primarily in the interior (F) or at the plasma membrane (G). Each bin contained four pixels, and the trace was fitted by a biexponential decay (Equation 22, q = 2). The range of fluorescence lifetimes is represented by the color scale below G. A.U., arbitrary units.

