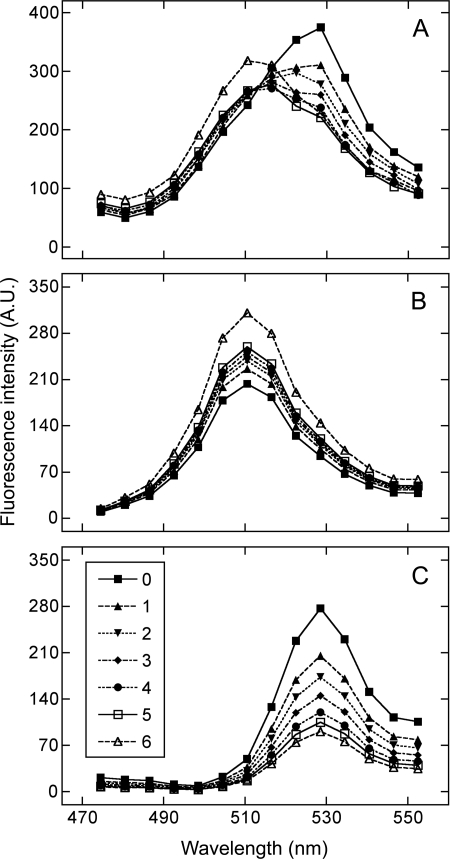
FIGURE 4.
Emission spectra from a CHO cell coexpressing eGFP-M2 and eYFP-M2. The observed spectra (A) and the constituent spectra obtained for eGFP-M2 (B) and eYFP-M2 (C) by deconvolution are shown for the cell before photobleaching (j = 0) and after successive bouts of irradiation at 514 nm (j = 1–6). The corresponding values for the relative intensity of the emission from the donor and the acceptor (kDA(j)/kAD(j)) are as follows (j = 0–6): 0.73, 1.10, 1.37, 1.69, 2.10, 2.47, and 3.43. A.U., arbitrary units.

