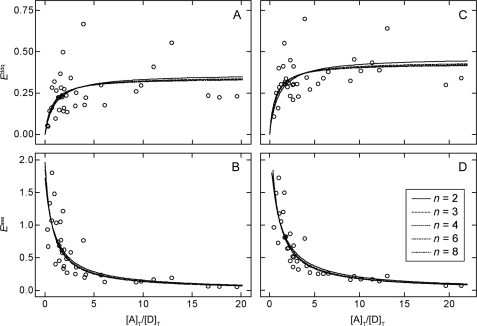
FIGURE 5.
Estimation of the pairwise FRET efficiency from the apparent efficiency at different ratios of acceptor to donor. Apparent FRET efficiencies were measured by donor-dequenching (Equation 1, A and C) and by acceptor-sensitized emission (Equation 2, C and D). In each case, the values of Eapp were calculated without regard to photobleaching of the donor (A and B) or adjusted as described under “Experimental Procedures” to compensate for such an effect (C and D). The lines represent the best fit of Equations 10 and 11 to the values of Eappddq and Eappase taken together (A and B, C and D) to yield a single value of E for each value of n listed in the inset to D. The fitted values of E are listed in Table 1.

