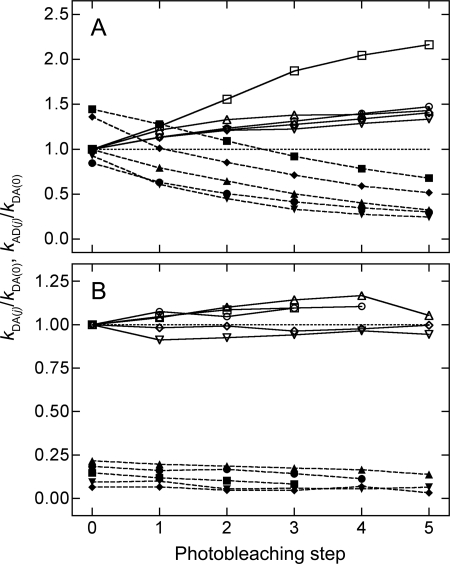
FIGURE 6.
Comparison of eYFP-M2 and eYFP-trFz1 for their interaction with eGFP-M2. Cells coexpressing either eGFP-M2 and eYFP-M2 (A) or eGFP-M2 and eYFP-trFz1 (B) were photobleached in a stepwise manner. Emission spectra measured before photobleaching and after each successive step were deconvoluted to obtain the values of kDA(j) ( ) and kAD(j) (- - -), which are shown relative to the value kDA(j) for the unbleached cell (i.e. kDA(0)). A value of 1 is indicated by the dotted line. Data from five cells are shown in each panel; the estimates of kDA(j) and kAD(j) from the same cell are presented as paired open (□, ▵, ▿, ○, ◇) and closed symbols (■, ▴, ▾, ●, ♦), respectively.

