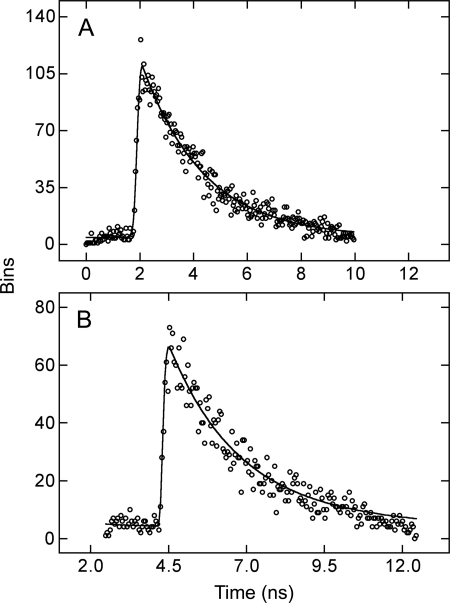
FIGURE 7.
Decay of fluorescence from donor-transfected and cotransfected cells. The loss of fluorescence over time is shown for 1 bin from the image of a cell expressing eGFP-M2 alone (A) and a cell coexpressing eGFP-M2 and eYFP-M2 (B). Each bin included four pixels, and the lines represent the best fit of a mono- (A) or a biexponential (B) to the data (i.e. Equation 22 with q = 1 or 2).

