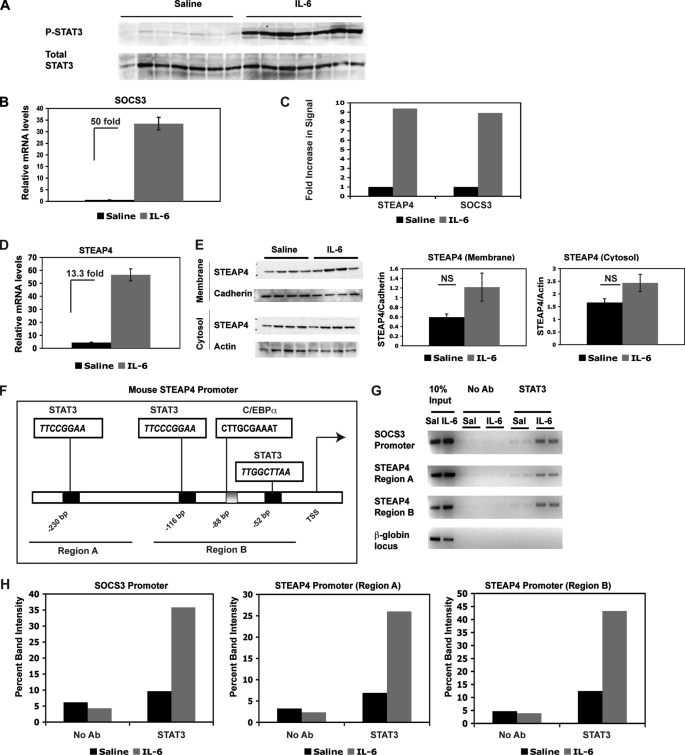
FIGURE 1.
steap4 expression is induced in mouse liver by IL-6. A, Western blot of P-STAT3 and total STAT3 in livers of mice treated with saline or IL-6 (n = 7 per group). B, qPCR analysis of socs3 mRNA in the same livers as in A. C, graphical representation of fold increase in signal in steap4 and socs3 as detected on microarrays (n = 3, p < 0.0001). D, qPCR analysis of steap4 mRNA levels in the same livers as in A (n = 7). E, Western blot analysis of STEAP4 protein levels in crude membrane fraction and cytosol (n = 4). Band intensities were measured using ImageJ, and STEAP4 levels were normalized to cadherin and actin levels in the two fractions, respectively. F, schematic representation of the mouse steap4 promoter depicting potential STAT3- and C/EBPα-binding sites. Regions that were amplified in ChIP assays are underlined and marked as region A and region B. G, ChIP assays demonstrating binding of STAT3 to the socs3 and steap4 promoters in vivo. Band intensities were measured and graphed (H). NS, not significant; Ab, antibody.

