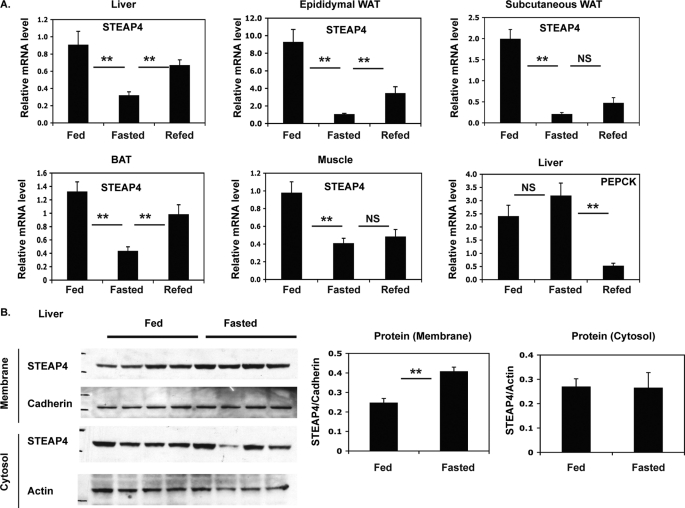
FIGURE 4.
Changes in steap4 expression with feeding and fasting. C57BL6 mice were fed ad libitum, fasted for 16 h, or fasted for 16 h and refed for 2 h and then sacrificed (n = 8 per group). A, relative steap4 mRNA expression levels in the liver, epididymal WAT, subcutaneous WAT, brown adipose tissue (BAT), and muscle as measured by qPCR are shown. Liver phosphoenolpyruvate carboxykinase (pepck) mRNA levels were measured by qPCR. B, STEAP4 protein levels in the liver were detected by Western blot in crude membrane and cytosol fractions and quantified. **, p ≤ 0.001; NS, not significant.

