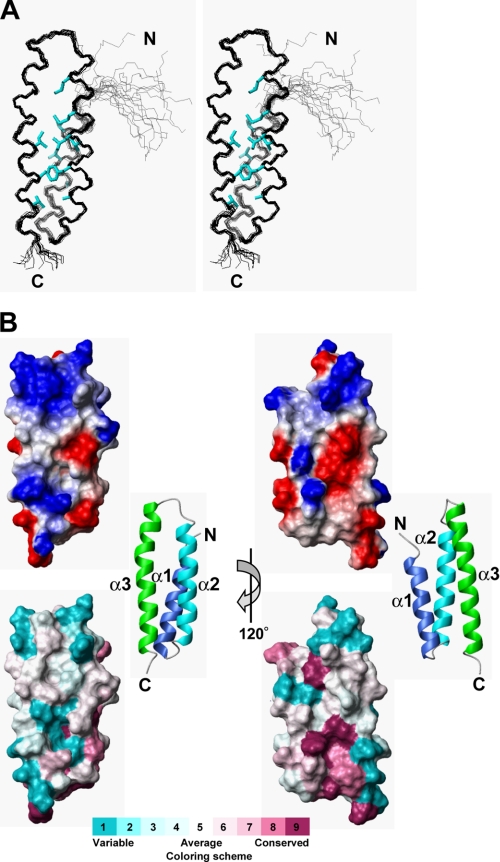
FIGURE 2.
Solution structure of kp60-NTD. A, stereo view of the best fit superposition of the 20 structures with lowest target functions. Side chains of buried residues with solvent accessibility less than 10% are shown (cyan). B, top, electrostatic surface potential mapped onto a van der Waals surface diagram. The color scale ranges between −20 kBT (red) to +20 kBT (blue), where kB is Boltzmann's constant and T is temperature. Bottom, sequence conservation among the kp60-NTDs is mapped on the surface. Conservative and variable residues are colored purple and cyan, respectively. The color codes were produced by ConSurf (63). Ribbon diagrams of the kp60-NTDs are shown in the middle. The surface composed of helices 2 and 3 is shown as the front view (left) and the rear view (right).

