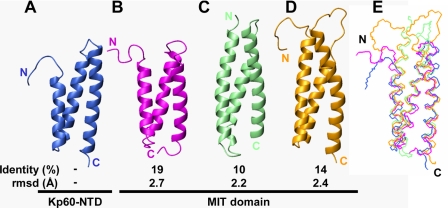
FIGURE 3.
Structural comparisons of kp60-NTD with MIT domains. Ribbon diagrams of the proteins are as follows: A, kp60 (PDB code 2rpa); B, Vps4b (PDB code 1wr0); C, spastin (PDB code 3eab); D, spartin (PDB code 2dl1). Identity (top, %) and r.m.s.d. (bottom, Å) between kp60-NTD and the MIT domains are also presented. E, superposition of kp60-NTD (blue), Vps4b-MIT (magenta), spastin-MIT (pale green), and spartin-MIT (orange).

