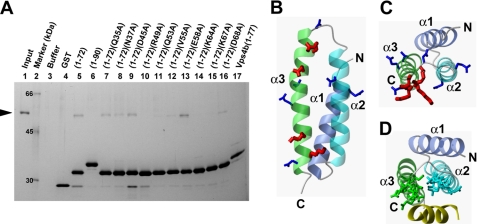
FIGURE 4.
Interactions of kp60-NTD with tubulin. A, pulldown assays of tubulin with GST-tagged kp60-NTDs of wild type and Ala mutants and Vps4b-MIT in vitro. Tubulin was used as the input. Molecular size is shown in lane 2. Only the buffer and the GST tag used as negative controls are shown in lanes 3 and 4. Recombinant proteins used for pulldown are indicated at the top of the gel. SDS-PAGE was silver-stained. B and C, side and top views of the ribbon diagram of kp60-NTD, respectively. Side chains of residues that were substituted with Ala are shown. In the pulldown assay, residues that were affected and unaffected by Ala mutations for tubulin binding are colored red and blue, respectively. D, top view of the ribbon diagram of the complex between Vps4-MIT and CHMP1a (yellow) (PDB code 2jq9). Side chains of the residues interacting between Vps4 and CHMP1a are indicated.

