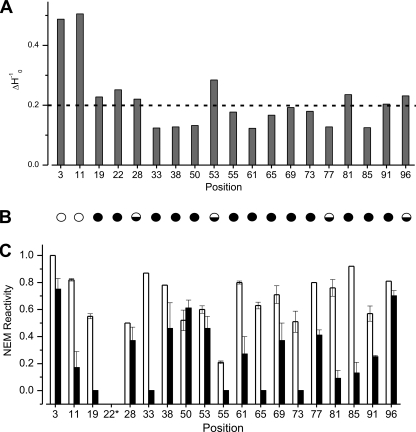
FIGURE 7.
Mobility and NEM reactivity of different residues in long straight fibrils of β2m. A, mobility measured from inverse central line width (ΔH0−1). The dashed line at 0.2 gauss−1 represents the value expected for buried side chains. B, representation of the absence (empty circle), presence (filled circle), or partial (half-filled circle) exchange narrowing in EPR spectra of 100% R1-labeled samples. C, NEM reactivity of cysteine residues in the native monomer (white) and long straight fibrils (black) determined using ESI-MS. Error bars are from two or three replicates of the NEM labeling procedure conducted with separate fibril samples. *, although 22R1 formed fibrils with high yield, the unlabeled counterpart (F22C) did not form fibrils under the conditions used.

