
FIGURE 4.
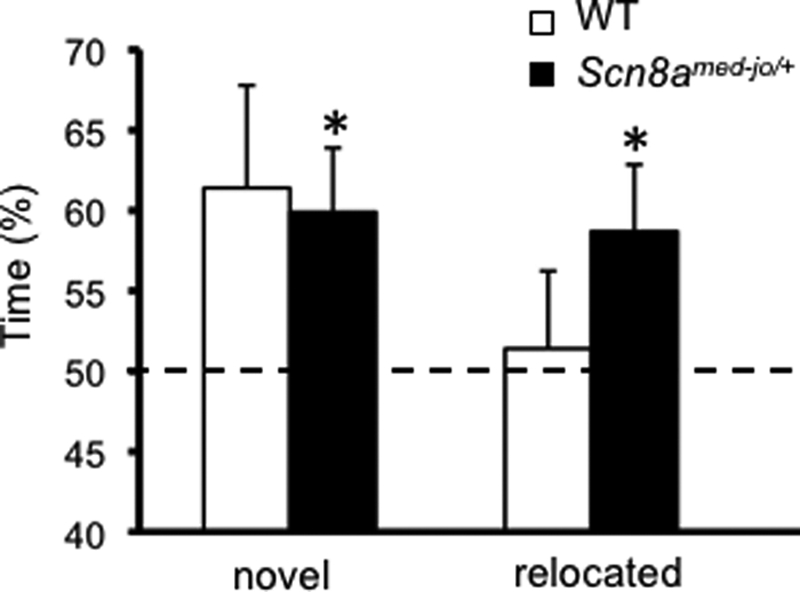
Scn8amed-jo/+ mutants show modest enhancement in spatial memory. Shown is a comparison of the percentage of time spent exploring the novel and relocated objects. A value of 50% represents chance performance. White bars, WT; black bars, Scn8amed-jo/+. Error bars, mean ± S.E. *, p < 0.05, one-tailed t test.