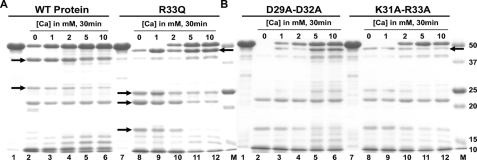
FIGURE 4.
Cluster 1 mutants have impaired Ca2+ response. The trypsin digestion pattern of cluster 1 mutants is different from that of the WT protein. A, lanes 1–6, untreated WT protein and incubation with 0, 1, 2, 5, and 10 mm CaCl2, respectively; lanes 7–12, untreated R33Q mutant protein and treatment with 0, 1, 2, 5, and 10 mm CaCl2, respectively. B, lanes 1–6, untreated D29A-D32A mutant protein and treatment with 0, 1, 2, 5, and 10 mm CaCl2, respectively; lanes 7–12, untreated K31A-R33A mutant protein and treatment with 0, 1, 2, 5, and 10 mm CaCl2, respectively. The M lanes are protein markers (Bio-Rad). The differences in the tryptic fragments are highlighted with black arrows.

