FIGURE 2.
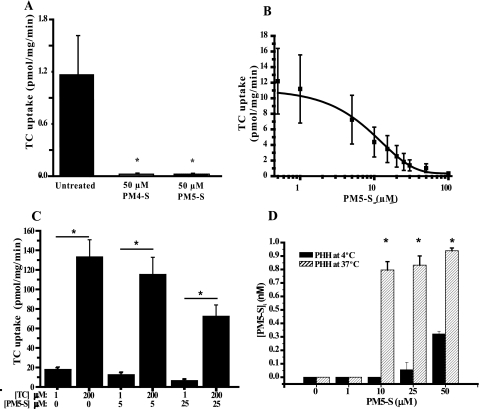
Impact of P4-S on PHH bile acid uptake. A, PHH incubated with 0.2 μm [3H]TC and 50 μm PM4-S/PM5-S for 5 min. *, p < 0.05 for total uptake with PM4-S/PM5-S versus total uptake. B, PM5-S dose-response curve. PHH incubated with 1 μm TC (0.2 μm [3H]TC + 0.8 μm TC) and variable PM5-S concentrations for 5 min. C, mode of inhibition of TC uptake mediated by PM5-S. PHH were incubated with 0.2 μm [3H]TC and unlabeled TC to make a final concentration of 1 or 200 μm, with/without 5 or 25 μm PM5-S for 5 min. *, p < 0.05 for PHH incubated with 200 μm TC versus 1 μm TC at all PM5-S concentrations. D, intracellular concentrations of PM5-S in PHH after incubation with PM5-S. PHH were incubated with 0–50 μm PM5-S for 10 min. GC-MS was used to quantify intracellular PM5-S levels. *, p < 0.05 for PM5-S-treated groups versus untreated control. Values represent mean ± S.E. of n = 3.

