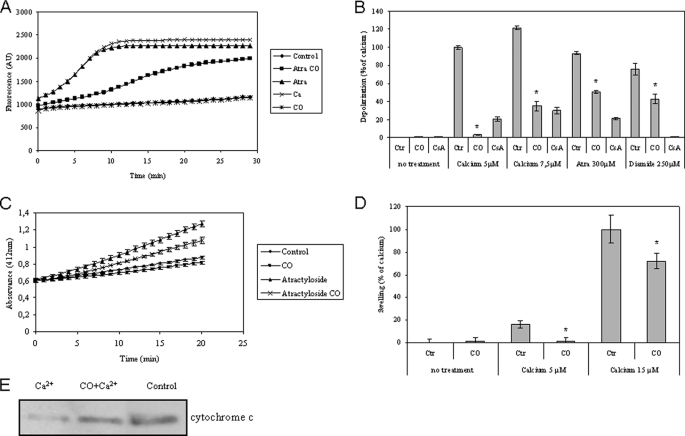
FIGURE 3.
Carbon monoxide effect on the mitochondrial membrane depolarization, inner membrane permeabilization, mitochondrial swelling, and cytochrome c release. All four experimental assays were performed using isolated non-synaptic mitochondria in modified brain buffer. A, representative micrograph for rhodamine 123 fluorescence change (λex, 485 nm; λem, 535 nm), measured for 30 min at 37 °C, in the absence or presence of CO at 10 μm and atractyloside at 300 μm or Ca2+ at 5 μm. B, quantitative expression of rhodamine 123 fluorescent measurements at 15 min of incubation. Isolated mitochondria were pretreated with CO at 10 μm or cyclosporine A (CsA) at 1 μm, and then Ca2+ at 0, 5, or 7.5 μm, atractyloside at 300 μm, or diamide at 250 μm was added. The values are expressed in relative percentage to 5 μm Ca2+ (100%). All values are mean ± S.D. (error bars), n = 3. *, p < 0.05 compared with control mitochondria for each inducer. C, an enzymatic assay based on citrate synthase activity was used to follow inner membrane permeabilization. Measurements were performed at 412 nm in the absence or presence of 10 μm CO and 300 μm atractyloside, at 37 °C for 20 min. All values are mean ± S.D., n = 3. D, mitochondrial swelling was measured by absorbance at 540 nm at 37 °C for 30 min, and the effect of calcium at 15 μm was normalized to 100% of swelling. Mitochondria were treated in the presence or absence of Ca2+ at 5 or 15 μm and/or CO at 10 μm. Experiments were done in triplicate and repeated three times. All values are mean ± S.D. (error bars), n = 3. *, p < 0.05 compared with control and CO-treated mitochondria. E, mitochondria, in the absence or presence of 10 μm CO, were treated with Ca2+ at 15 μm at 37 °C for 30 min, followed by centrifugation to separate mitochondrial pellet for immunodetection of cytochrome c release.

