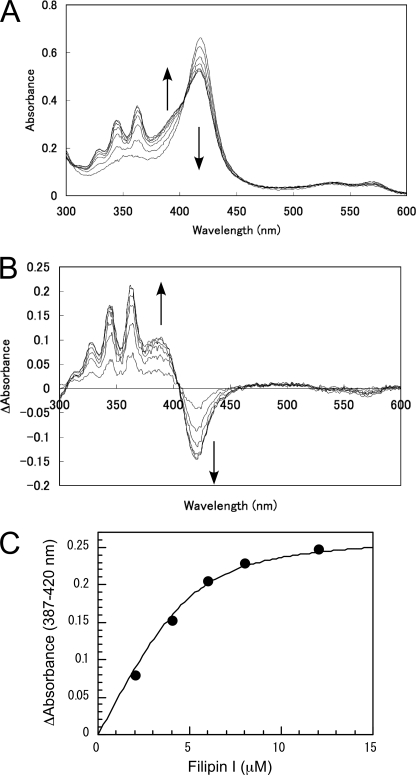
FIGURE 3.
Spectral changes of CYP105D6 (ferric resting state) upon the addition of increasing concentrations of filipin I (A), its difference spectra (B), and the titration curve calculated using the values of absorption differences at 387 and 420 nm (C). A nonlinear fitting with a quadratic equation was applied to the titration curve.

