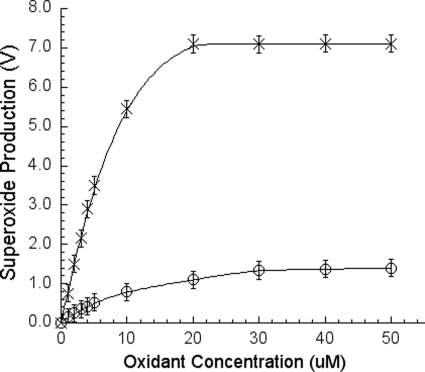
FIGURE 6.
High potential oxidant (cytochrome c or ferricyanide) concentration-dependent superoxide generation under a constant amount of ubiquinol. The superoxide production was measured as described under “Experimental Procedures.” The curve with open circles represents cytochrome c, and the curve with Xs represents ferricyanide. Solution A contains 100 mm Na+/K+ phosphate buffer, pH 7.4, 6 mm sodium cholate, and a different concentration of cytochrome c or ferricyanide. Solution B contains 100 mm Na+/K+ phosphate buffer, pH 7.4, 6 mm sodium cholate, 50 μm Q-H2, and 4 μm MCLA. Each data point represents an average of four experiments. Error bars indicate S.D.

