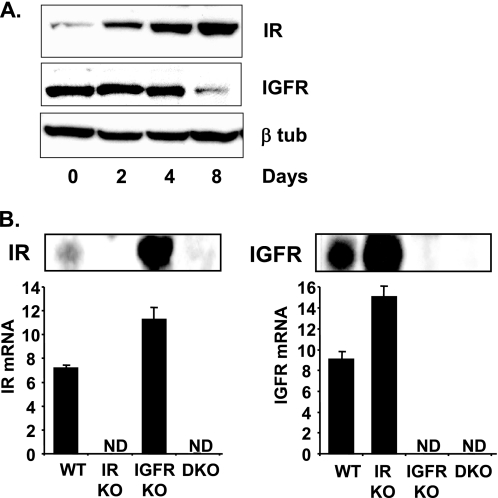
FIGURE 2.
IR and IGF1R expression in WT, IRKO, IGFRKO, and DKO cells. A, WT brown preadipocytes were differentiated for 2, 4, and 8 days as described under “Experimental Procedures” and IR, IGF1R, and β-tubulin protein levels were measured by Western blot analysis. A representative blot from 3 experiments is shown. B, IR and IGF1R immunoblots were performed on confluent WT, IRKO, IGFRKO, or DKO cells. mRNA was extracted from confluent WT, IRKO, IGFRKO, or DKO cells and IR and IGF1R mRNA expression were measured by real time PCR using specific oligonucleotide primers. The data were normalized to levels of TBP mRNA. ND, not detected. Results are mean ± standard error of the mean from 5 independent measurements.

