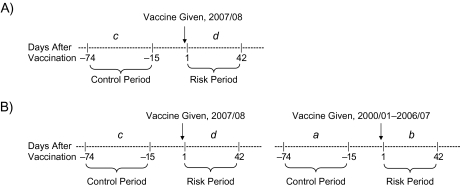
Figure 1.
Risk and control periods for an example potential adverse event proximal to vaccination in the 2007/08 influenza season. The cumulative number of events occurring during each period, summed across previous seasons, is represented by a and b. The number of events occurring during the current season is represented by c and d. A) In the self-controlled case series approach, d is compared with c. B) In the difference-in-difference approach, d is compared with c, adjusting for the comparison of b with a.

