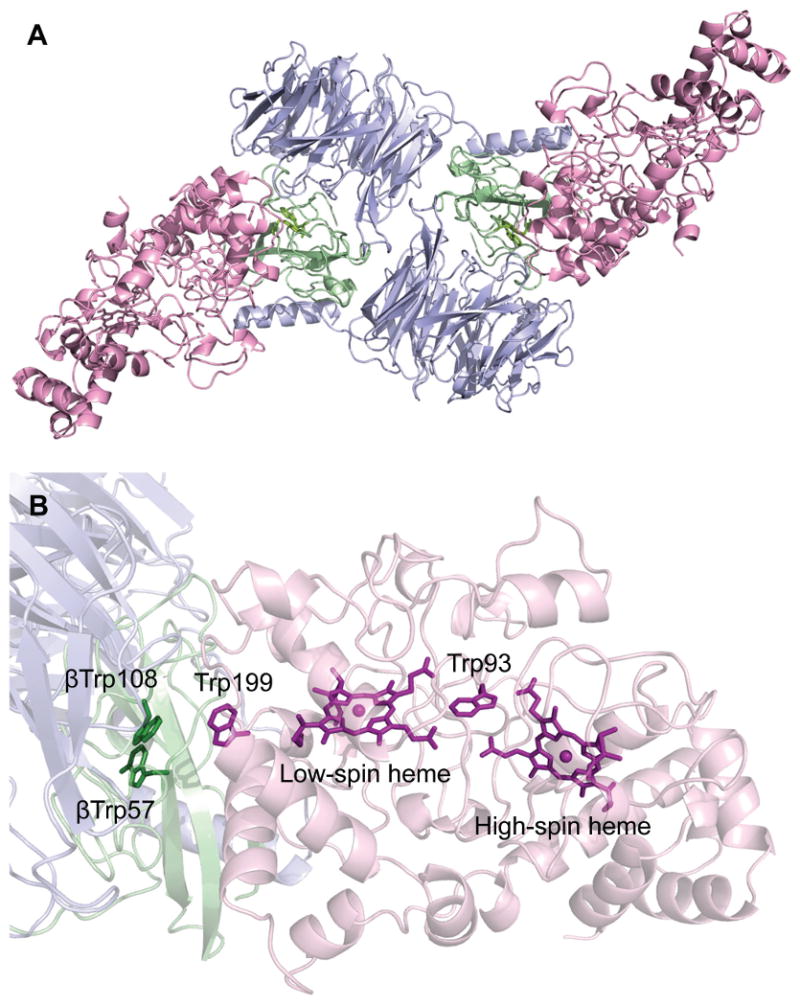
Figure 1.

(A) Overall ribbon representation of the MauG-preMADH complex. (B) Spatial layout of potential redox groups. Color scheme is MauG (pink); preMADH α (blue) and β (green). The hemes, Trp93, Trp199 of MauG and βTrp108 and mono-hydroxylated βTrp57 of preMADH are drawn explicitly in a stick representation. Figure produced using PyMOL (http://www.pymol.org/).
