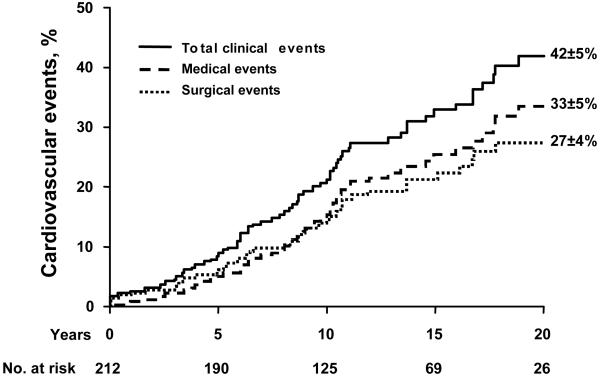
Figure 5.
Incidence of any cardiovascular event (total of medical or surgical; solid line), of medical events (cardiac death, congestive heart failure, new cardiac symptoms, stroke and endocarditis; dashed line) and of surgical events (aortic valve replacement, surgical valvotomy, ascending aorta surgery or coarctation surgery; dotted line). The numbers at the bottom indicate the patients at risk for each interval. The event rates (±SE) are indicated at 20 years.

