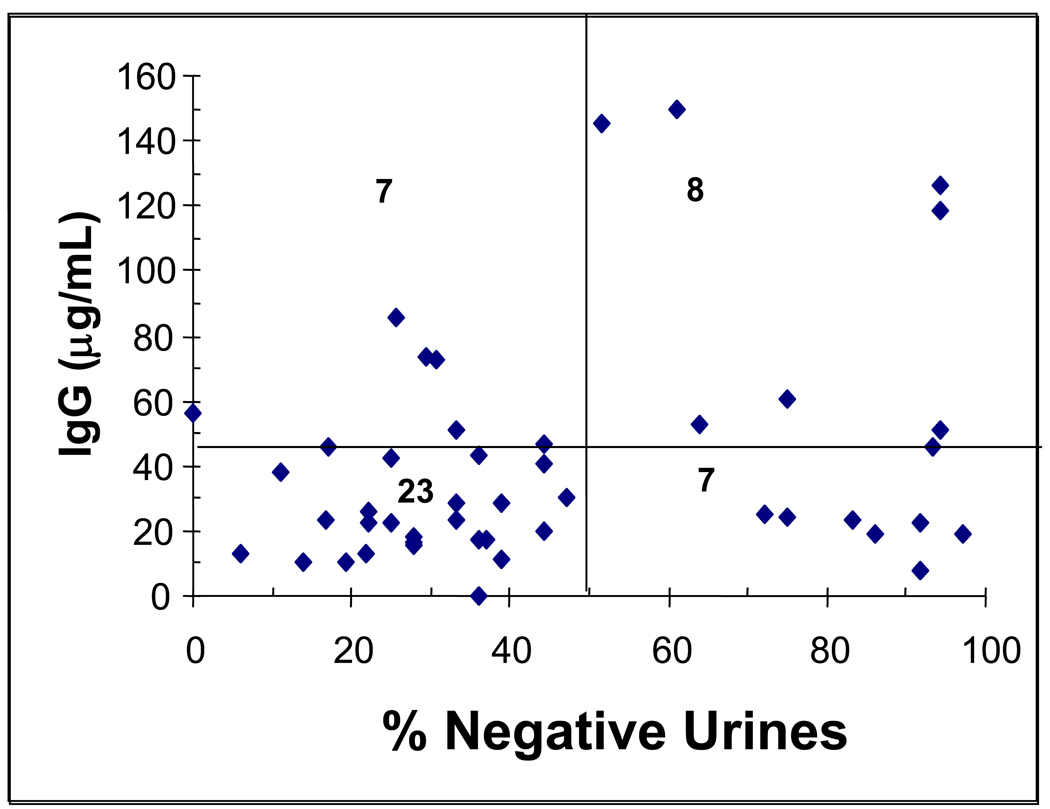
Figure 4. Scatter-plot of peak antibody response by % cocaine-negative urines.
Filled diamonds are individual vaccinated subject values for peak antibody response (typically at week 16) plotted against their percentage of cocaine-negative urines using the Preston criteria for new uses of cocaine during weeks 8 through 20. The graph is divided into quadrants by a horizontal line at the 43 ug/ml antibody and a vertical line at 50% cocaine free urines. The numbers in each quadrant represent the number of subjects in each quadrant. The proportion of subjects who had 50% or more cocaine free urines is significantly greater in those with anti-cocaine IgG antibody > 43 ug/ml than those with lower antibody levels (Fishers test, P<0.04).

