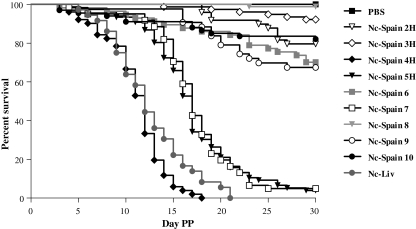
Figure 2.
Kaplan–Meier survival curves for neonates born from dams infected on day 7 of pregnancy with 2 × 10⁶ tachyzoites from the different N. caninum isolates included in this study and the uninfected group (see graphic legend). Each point represents the percentage of survival animals at that day.

