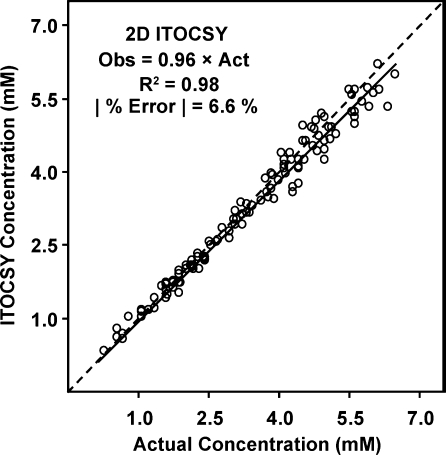
Figure 4.
Metabolite concentrations (N = 121) measured by calibrated 2D 1H−1H ITOCSY vs known values. The dotted line indicates the ideal regression line (slope = 1). The data represent 24 synthetic mixtures; each mixture contained 30 metabolite standards, 6 of which were supplemented with a [U−13C]-labeled version. ITOCSY values were calculated from the observed 13C/12C ratio and were corrected for systematic quantitative errors using empirically derived coefficients. The error estimate reflects the average absolute error for all ITOCSY-derived metabolite concentrations. The compositions of the synthetic mixtures are listed in Supporting Information Table S-1.

