
Figure 6.
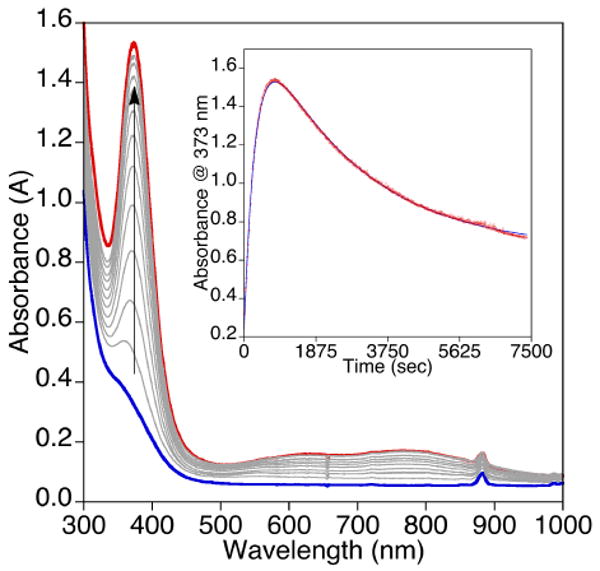
UV-vis spectroscopic data for the reaction of (tBu2Me2eda)Cu(BF) in CH2Cl2 (0.67 mM) (blue spectrum) with O2 at −80 °C with the feature at 373 nm having an approximate ε ∼ 2,300 M-1cm-1. The inset displays the time trace for the formation and decay of the intermediate (red spectrum) with data monitored at 373 nm and fit to a bi-exponential equation [At = A1 + A2*exp(-k2*t) − A3*exp(-k1*t), k1 = 0.0034 s-1 and k2 = 0.00039 s-1; R = 0.999].