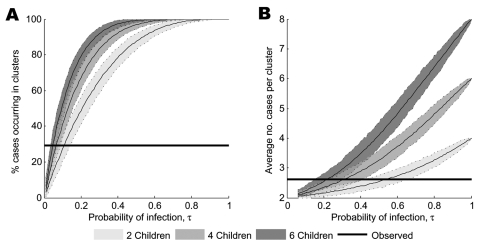
Figure 2.
Relationship between data simulated under the null model and the observed pattern of family clustering for A) the proportion of cases occurring in clusters (given 261 total cases) and B) the average number of cases per cluster (given 36 clusters). Estimates of the mean are represented by solid lines; the shaded regions between the dotted lines show 95% prediction intervals for 1,000 simulations. The observed data are represented by the solid black lines.

