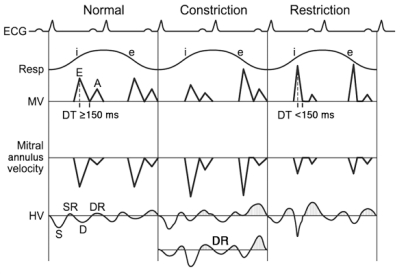
FIGURE 15.
Schematic diagram of Doppler echocardiographic features in constrictive pericarditis vs restrictive cardiomyopathy. Schematic illustration of Doppler velocities from mitral inflow (MV), mitral annulus velocity, and hepatic vein (HV). Electrocardiographic (ECG) and respirometer (Resp) recordings indicating inspiration (i) and expiration (e) are also shown. A = atrial filling; D = diastolic flow; DR = diastolic flow reversal; DT = deceleration time; E = early diastolic filling; S = systolic flow; SR = systolic flow reversal. Stippled areas under the curve represent flow reversal.
From reference 63.

