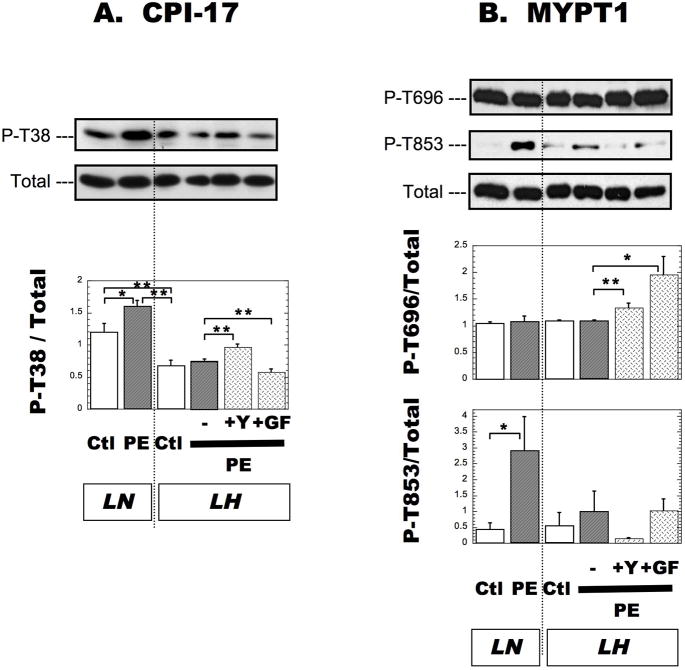
Figure 4. Phosphorylation of CPI-17 at Thr38 (A), MYPT1 (B) at Thr696 and at Thr853 in SMA from LN and LH rats.
Phosphorylation of each protein was measured by immunoblotting method as described in Methods. The band intensity of anti-phospho-CPI-17 Thr38 (A), MYPT1-Thr696, and -Thr853 (B) was normalized with that of anti-pan CPI-17 (A), and MYPT1 (B), respectively. Data from SMA without and after a 10-min exposure to 30 μM PE and 2.5 mM CaCl2 are indicated as Ctl and PE, respectively. Y27632 (+Y) and GF109203x (+GF) were added as described in Figure 2. All samples were loaded on single gel for densitometry. The mean values ± SEM were obtained from 3 independent assays. *p < 0.01, **p < 0.05.

