
Figure 6. Comparison of Ca2+-induced contraction of SMA and aorta from LH and LN.
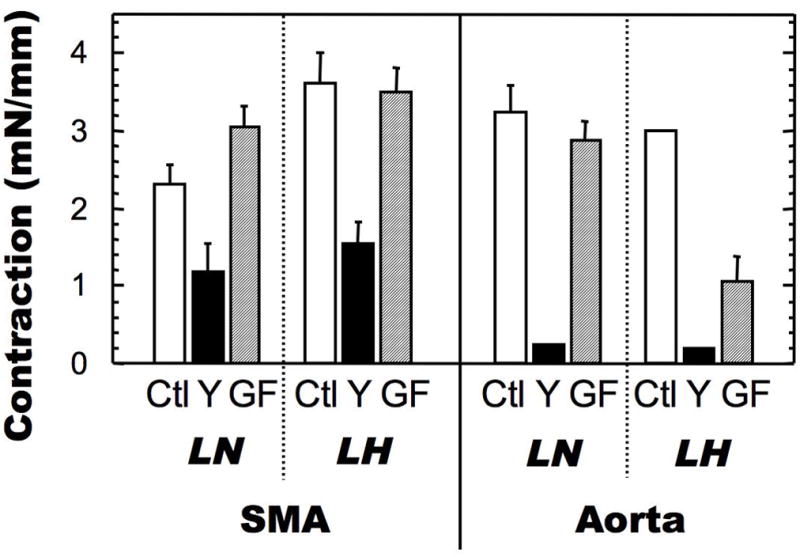
Contraction was assayed as described in Figures 2 and 5. The data for CaCl2 contraction at 2.5 mM (for SMA) and 10 mM (for aorta) in the presence of PE are shown in the bar graph. The mean values ± SEM of 4–13 experiments are shown. *p < 0.05, LN versus LH.