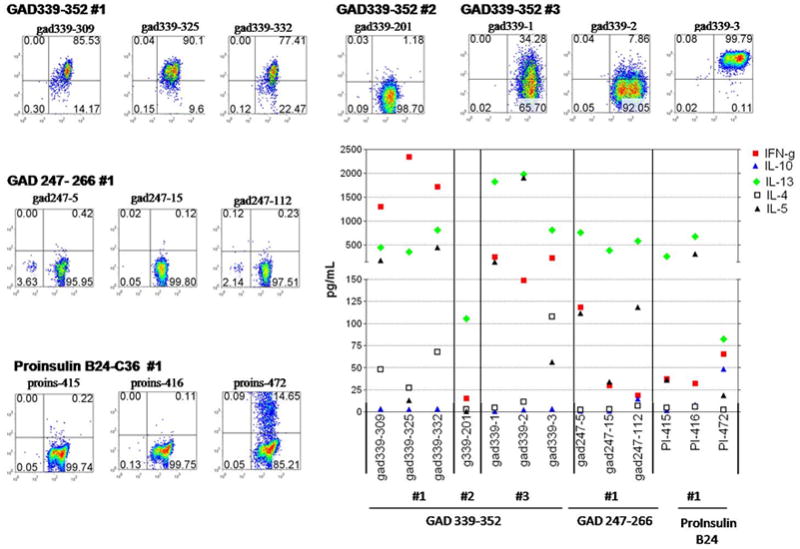
Figure 4. Tetramer staining and cytokine profiles of the T-cell clones.

The DR301-GAD339–352 tetramer was used to stain T-cell clones single cell sorted from the PBMC samples obtained at three time points (#1–3, upper panel). Similarly, DR301-GAD 247–266 and proinsulin B24-C36 tetramers were used to stain clones derived from the first time point (middle, lower left panels). In all cases tetramer staining was evaluated on the viable lymphocytic population as gated based on the forward/side scatter profile. The frequency of CD4/tetramer-positive cells is noted in the upper right quadrant. Staining with the control tetramer containing DR301 binding irrelevant peptide (flu, NS-1) was set at 0.2%. Cytokines (pg/ml, Y axis) were determined from the supernatants collected from triplicate cultures of the T cell clones at 48hrs post stimulation with DR301+ irradiated PBMC pulsed with the cognate peptides (middle-lower right panel).
