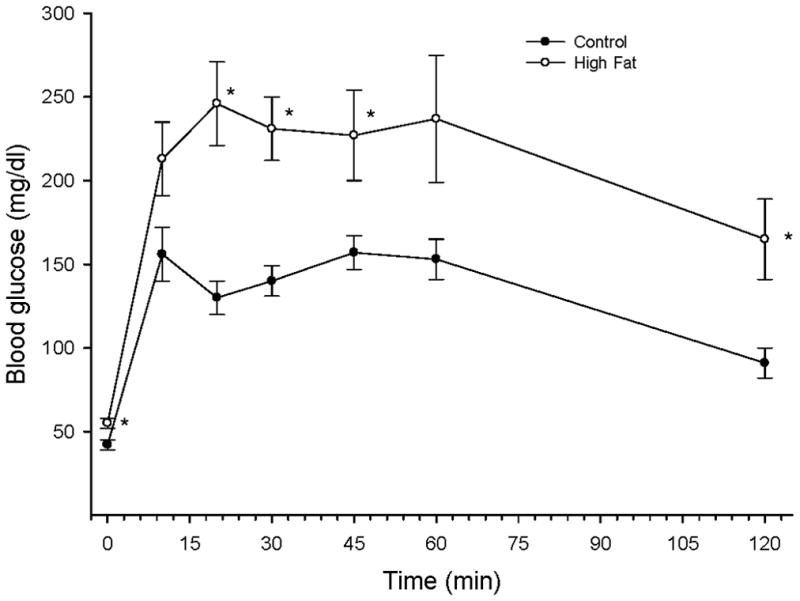
Figure 1. Effect of a high fat diet on glucose tolerance.

Rats were fed a standard or high fat diet for 32 weeks. Afterwards glucose tolerance was determined as described in the Methods section. Data are presented as the mean ± SEM in mg/dl. * p < 0.05, for individual data points compared to rats fed a standard diet (control). The area under the curve (AUC) was significantly different p < 0.01 for high fat fed rats vs. control. The number of rats in each group was the same as shown in Table 1.
