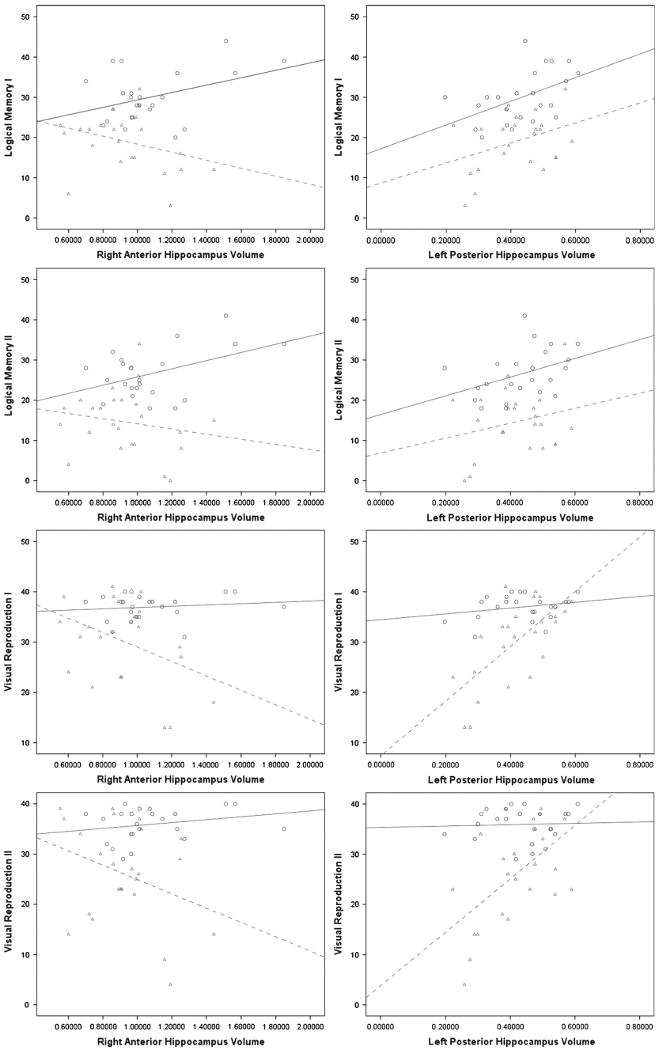
Fig. 3.

The most dramatic correlational group differences were between memory test scores and right anterior and left posterior hippocampus. The scatterplots depict bivariate correlations between the variables (hippocampus volumes are in cc). Blue = control group, green = schizophrenia group.
