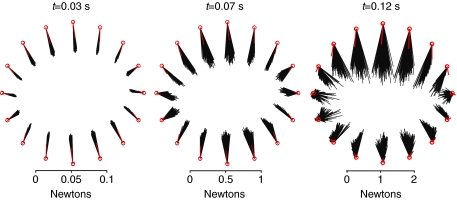
Fig. 4.
Horizontal plane projections of the endpoint force response to perturbations in several directions. Simulations based on 200 random activation patterns (black lines) and ε0 (red lines) in each direction, with length feedback. Initially (t=0.03 s), the horizontal component of the endpoint response is largely independent of activation pattern. Responses to sagittal plane perturbations produce slightly larger amplitude responses but are nearly opposite the direction of perturbation. At the peak of acceleration (t=0.07 s), the response remains consistent across activation patterns and the directional bias remains subtle. As the constant velocity phase begins (t=0.12 s), the response direction is distinctly biased in amplitude and direction towards the sagittal plane. At this time point, lateral perturbations produce responses much smaller in amplitude and much more variable in direction. The response of the minimum muscle stress activation pattern (ε0) is shown in red.

