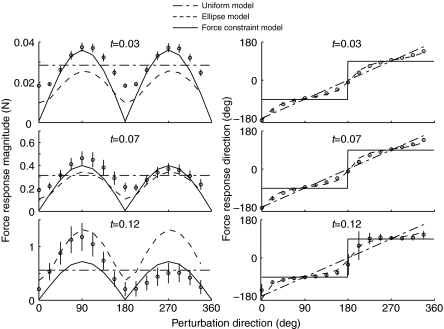
Fig. 5.
Magnitude and direction of simulated force responses as a function of perturbation direction. Symbols represent means ± s.d. In the case of direction, error bars are frequently smaller than the plot symbol. Standard deviations across all perturbation directions are 0.6 deg at 0.03 s, 1.6 deg at 0.07 s and 6 deg at 0.12 s. Solid lines represent force constraint model, aligned to −91 deg; dashed line represents ellipsoid model and dash–dotted line represents uniform model.

