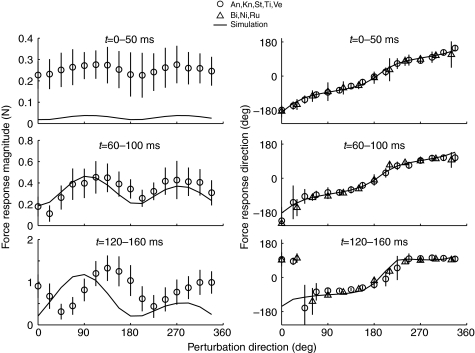
Fig. 6.
Postural responses summarized from eight animals: Bi, Ni and Ru (Jacobs and Macpherson, 1996) and An, Kn, St, Ti and Ve (Macpherson et al., 2007; Torres-Oviedo et al., 2006) with corresponding simulation response for comparison. Animals from Jacobs and Macpherson are not shown in the magnitude plots because variation of perturbation amplitude with direction distorts the magnitude response. Experiment time (t) 0–50 ms precedes active muscle responses, and force responses, like the simulation responses at t=0.03, deviate only slightly from the perturbation direction. By experiment time window 60–100 ms, force response deviates noticeably from the direction of perturbation. By experiment time 120–160 ms (simulation time 0.12 s), force responses are strongly constrained along the −83 deg to 97 deg axis. There is a narrow range of perturbation angles perpendicular to the bias axis where the response is more variable in direction and amplitude. Experimental force magnitudes are close to simulation force magnitudes only in the middle window. During experiment time 120–160 ms, force magnitudes are similar in amplitude but offset by 45 deg in phase. Both model and experiment respond more vigorously to forward (0–180 deg) perturbations than to backward (180–360 deg) perturbations during this active phase. Means ± s.d.

