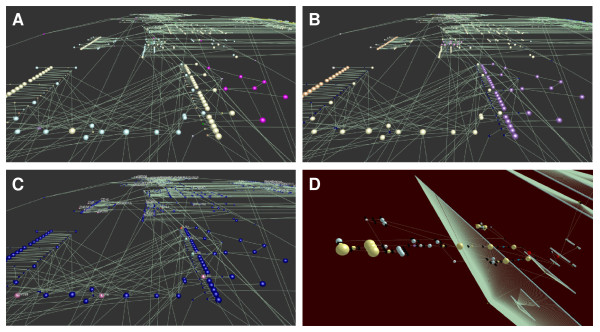
Figure 5.
Pathway Representation in 3D Environment. Large macrophage activation pathway rendered in 3D environment where node shape, size and colour represents a components identity. (A) Nodes coloured according to type e.g. light blue - proteins, yellow - protein complexes, purple - generic molecular species. All process nodes are depicted as small cubes and coloured according to type. (B) Nodes coloured according to cellular location e.g. brown - plasma membrane, yellow - cytoplasm, purple - endosome, green nucleus. Process nodes/Boolean logic operators are shown as having no cellular location and are coloured dark blue (no class). (C) Nodes coloured according to overlay of data, in this case expression data. Colour of nodes represents co-expression cluster following stimulation of mouse macrophages with Ifnβ (D) A representation of the interferon-beta signalling pathway and the transcriptional network it controls. The signalling network is represented using the mEPN3D notation with the addition of transition nodes for use in modelling studies. Connected to it are clusters of genes up or down regulated by Ifnb which have been stacked in at different layers depending on the their time course of activation/repression.

