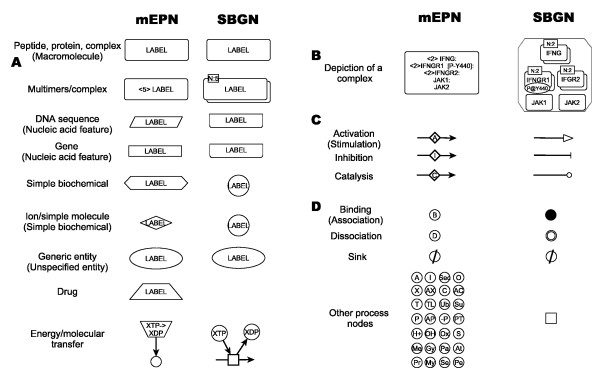
Figure 6.
Comparison of mEPN to SBGN. Main glyphs used in the mEPN shown on the left, SBGN glyphs on the right. (A) Shows the main symbols used for depicting biological entities and (B) the different ways the two schemes represent protein complexes. (C) Different way of showing edge meaning and (D) the different symbols used to depict various processes. mEPN names for these entities/activities given alongside and SBGN names, when different, in brackets beneath. For a more in depth comparison of the two notation schemes see Additional file 4.

